Consdier a binomial point process (BPP) where n points are uniformly sampled with a d-dimensional ball of radius R centered at the origin. We want to know about the euclidean distance from the origin to its m-th nearest point. The special case of m=1 will be the shortest distrance from the origin.
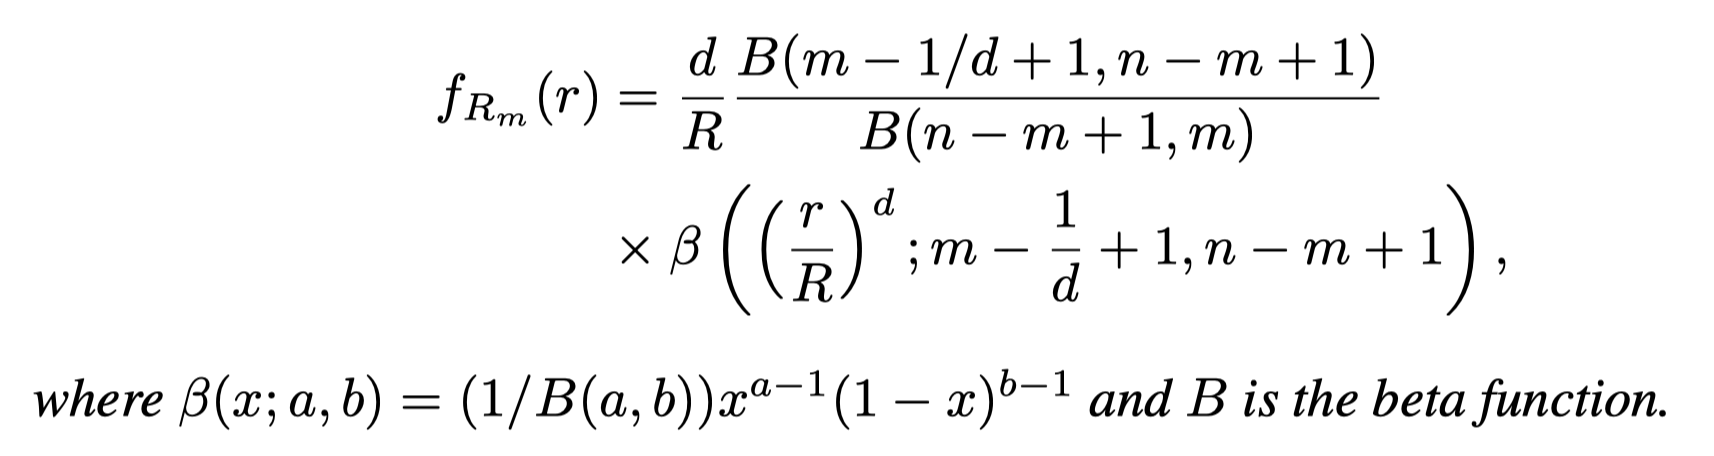
The distribution of the distance of the m-th nearest point follows a generalized beta distribution:
Followings are some plots showing some (counter-intuitive) results of the distributions of the nearest distance.
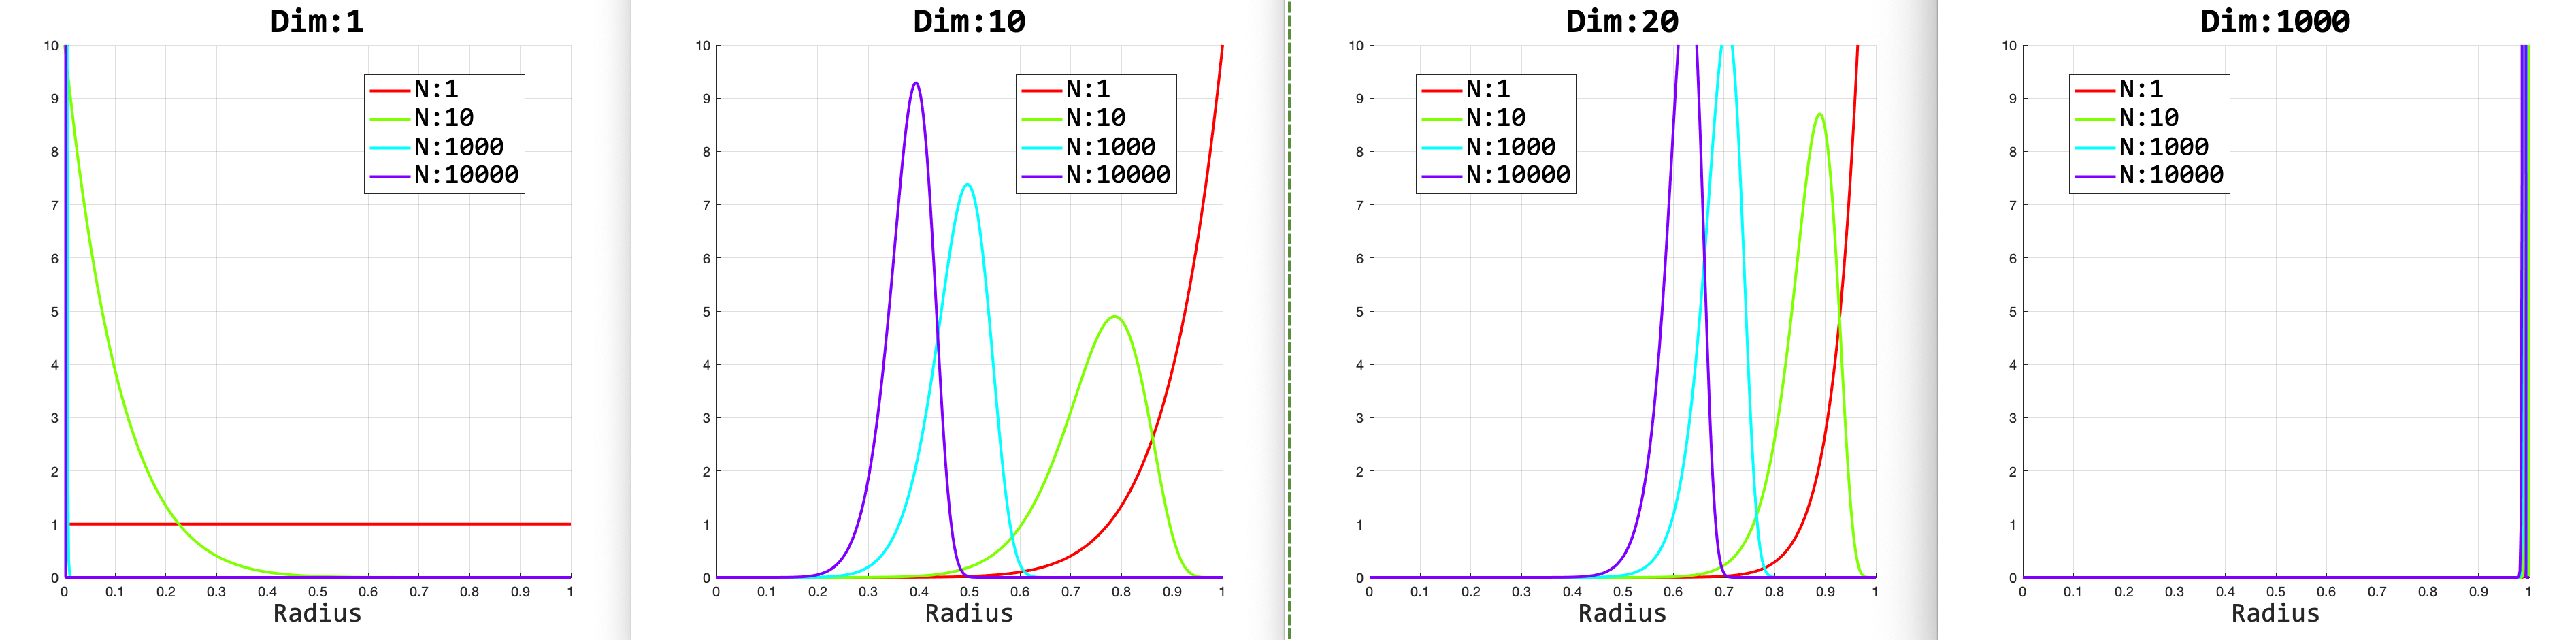
The well-known 'bubble soap' phenomenon is shown in the high dimensional case (dim=1,000) in that most of the probability densities are concentrated in the cover of a sphere (R=1).
Code:
더보기
R = 1; % radius
n_list = [1,10,1000,10000]; % number of points
d_list = [1,10,20,1000]; % dimension
m_list = [1]; % m-th nearest
L = 500;
r_list = linspace(1e-8,R,L); % radius list

B_func = @(a,b)(beta(a,b));
beta_func = @(x,a,b)( (1/B_func(a,b))*(x^(a-1))*((1-x)^(b-1)) );
f_Rm = @(r,d,R,m,n)( (d/R)*(B_func(m-1/d+1,n-m+1)/B_func(n-m+1,m))*...
    beta_func((r/R)^d,m-1/d+1,n-m+1) ); % pdf

f_ndm = cell(length(n_list),length(d_list),length(m_list));
for n_idx = 1:length(n_list)
    n_val = n_list(n_idx);
    for d_idx = 1:length(d_list)
        d_val = d_list(d_idx);
        for m_idx = 1:length(m_list)
            m_val = m_list(m_idx);
            f_vals = zeros(1,L);
            for r_idx = 1:L
                r_val = r_list(r_idx);
                f_val = f_Rm(r_val,d_val,R,m_val,n_val);
                f_vals(r_idx) = f_val;
            end
            % Append
            f_ndm{n_idx,d_idx,m_idx} = f_vals;
        end
    end
end
fprintf('Done.\n');

% Plot some useful stuffs
d_list_check = d_list;
n_list_check = n_list;
for d_idx = 1:length(d_list_check)
    d_val = d_list_check(d_idx); % dimension
    fig = figure(d_idx); set_fig_size(fig,[(d_idx-1)*0.25,0.6,0.25,0.4]); hold on;
    cnt = 0; hs = []; strs = [];
    colors = hsv(length(n_list_check));
    for n_idx = 1:length(n_list_check)
        n_val = n_list_check(n_idx);
        % Get and plot
        f_vals = f_ndm{find(n_list==n_val),find(d_list==d_val),1};
        cnt = cnt + 1;
        hs(cnt) = plot(r_list,f_vals,'-','linewidth',2,'Color',colors(n_idx,:));
        strs{cnt} = sprintf('N:%d',n_val);
    end
    xlabel('Radius','fontsize',20,'fontname','consolas');
    ylim([0,10]); grid on;
    legend(hs,strs,'fontsize',20,'fontname','consolas','location','best');
    title(sprintf('Dim:%d',d_val),'fontsize',25,'fontname','consolas');
    set(gcf,'color','w');
end
'Enginius > Machine Learning' 카테고리의 다른 글
| Gaussian Process를 이용한 mu, dmu, ddmu 구하기 (0) | 2021.02.01 |
|---|---|
| Uncertainty-related paper (0) | 2019.12.10 |
| Curation of RL papers (0) | 2019.12.06 |
| VAE에 대한 잡설 (2) | 2018.08.03 |
| 2018년 기존 최신 논문들 (RL 위주) (1) | 2018.04.07 |

